Dataset
This dataset, real_estate_texas_500_2024.csv, was sourced from Kaggle.
Data Bias:
- According to the source, this dataset features “a curated selection of 500 property listings. It encompasses a wide array of properties, reflecting the diverse real estate landscape across Texas”, which indicates that there is some bias with the data selection.
RMarkdown Code
Purpose
This project focuses on data visualization, with R, to explore what the average single-family home in Texas could look like.
Data Exploration
- Original data: 501 rows, 14 columns.
| Category | Field | Description |
|---|---|---|
| Categorical | status | Current status of listing - all are currently for sale |
| sub_type | Sub Category of property type, such as “condo” or “townhouse” | |
| text | Text description narrative used in listing, descriptor of characteristics of property | |
| type | General type of property | |
| year_built | Year the property was constructed | |
| url | Realtor.com page for listing | |
| id | Unique Numerical Listing ID | |
| Numerical | listPrice | The asking price |
| baths | Total number of baths in the house | |
| baths_full | Number of full bathrooms | |
| baths_full_calc | Calculated number of full bathrooms | |
| beds | Number of Bedrooms | |
| sqft | Square footage of property | |
| stories | Number of stories in property | |
| Geographical (created through URL column extraction) | street_address | The street address of the property listing |
| city | City of listing | |
| state | State of listing (Texas) | |
| zip | Zip code of listing |
Data Cleaning
578 missing values (NAs) were identified during the data-cleaning process.
Collaboration with our team, GraphGurus:
- Performed by Francisco Lozano: KNN Imputation to clean missing square footage, # of stories, and year built.
- Performed by Ken Vellian: Regular expressions used to create the new street address, city, state, and zip columns from the URL column. Also used regular expressions to extract square footage and acre size from the text column and fill in missing square footage values.
Initial Analysis
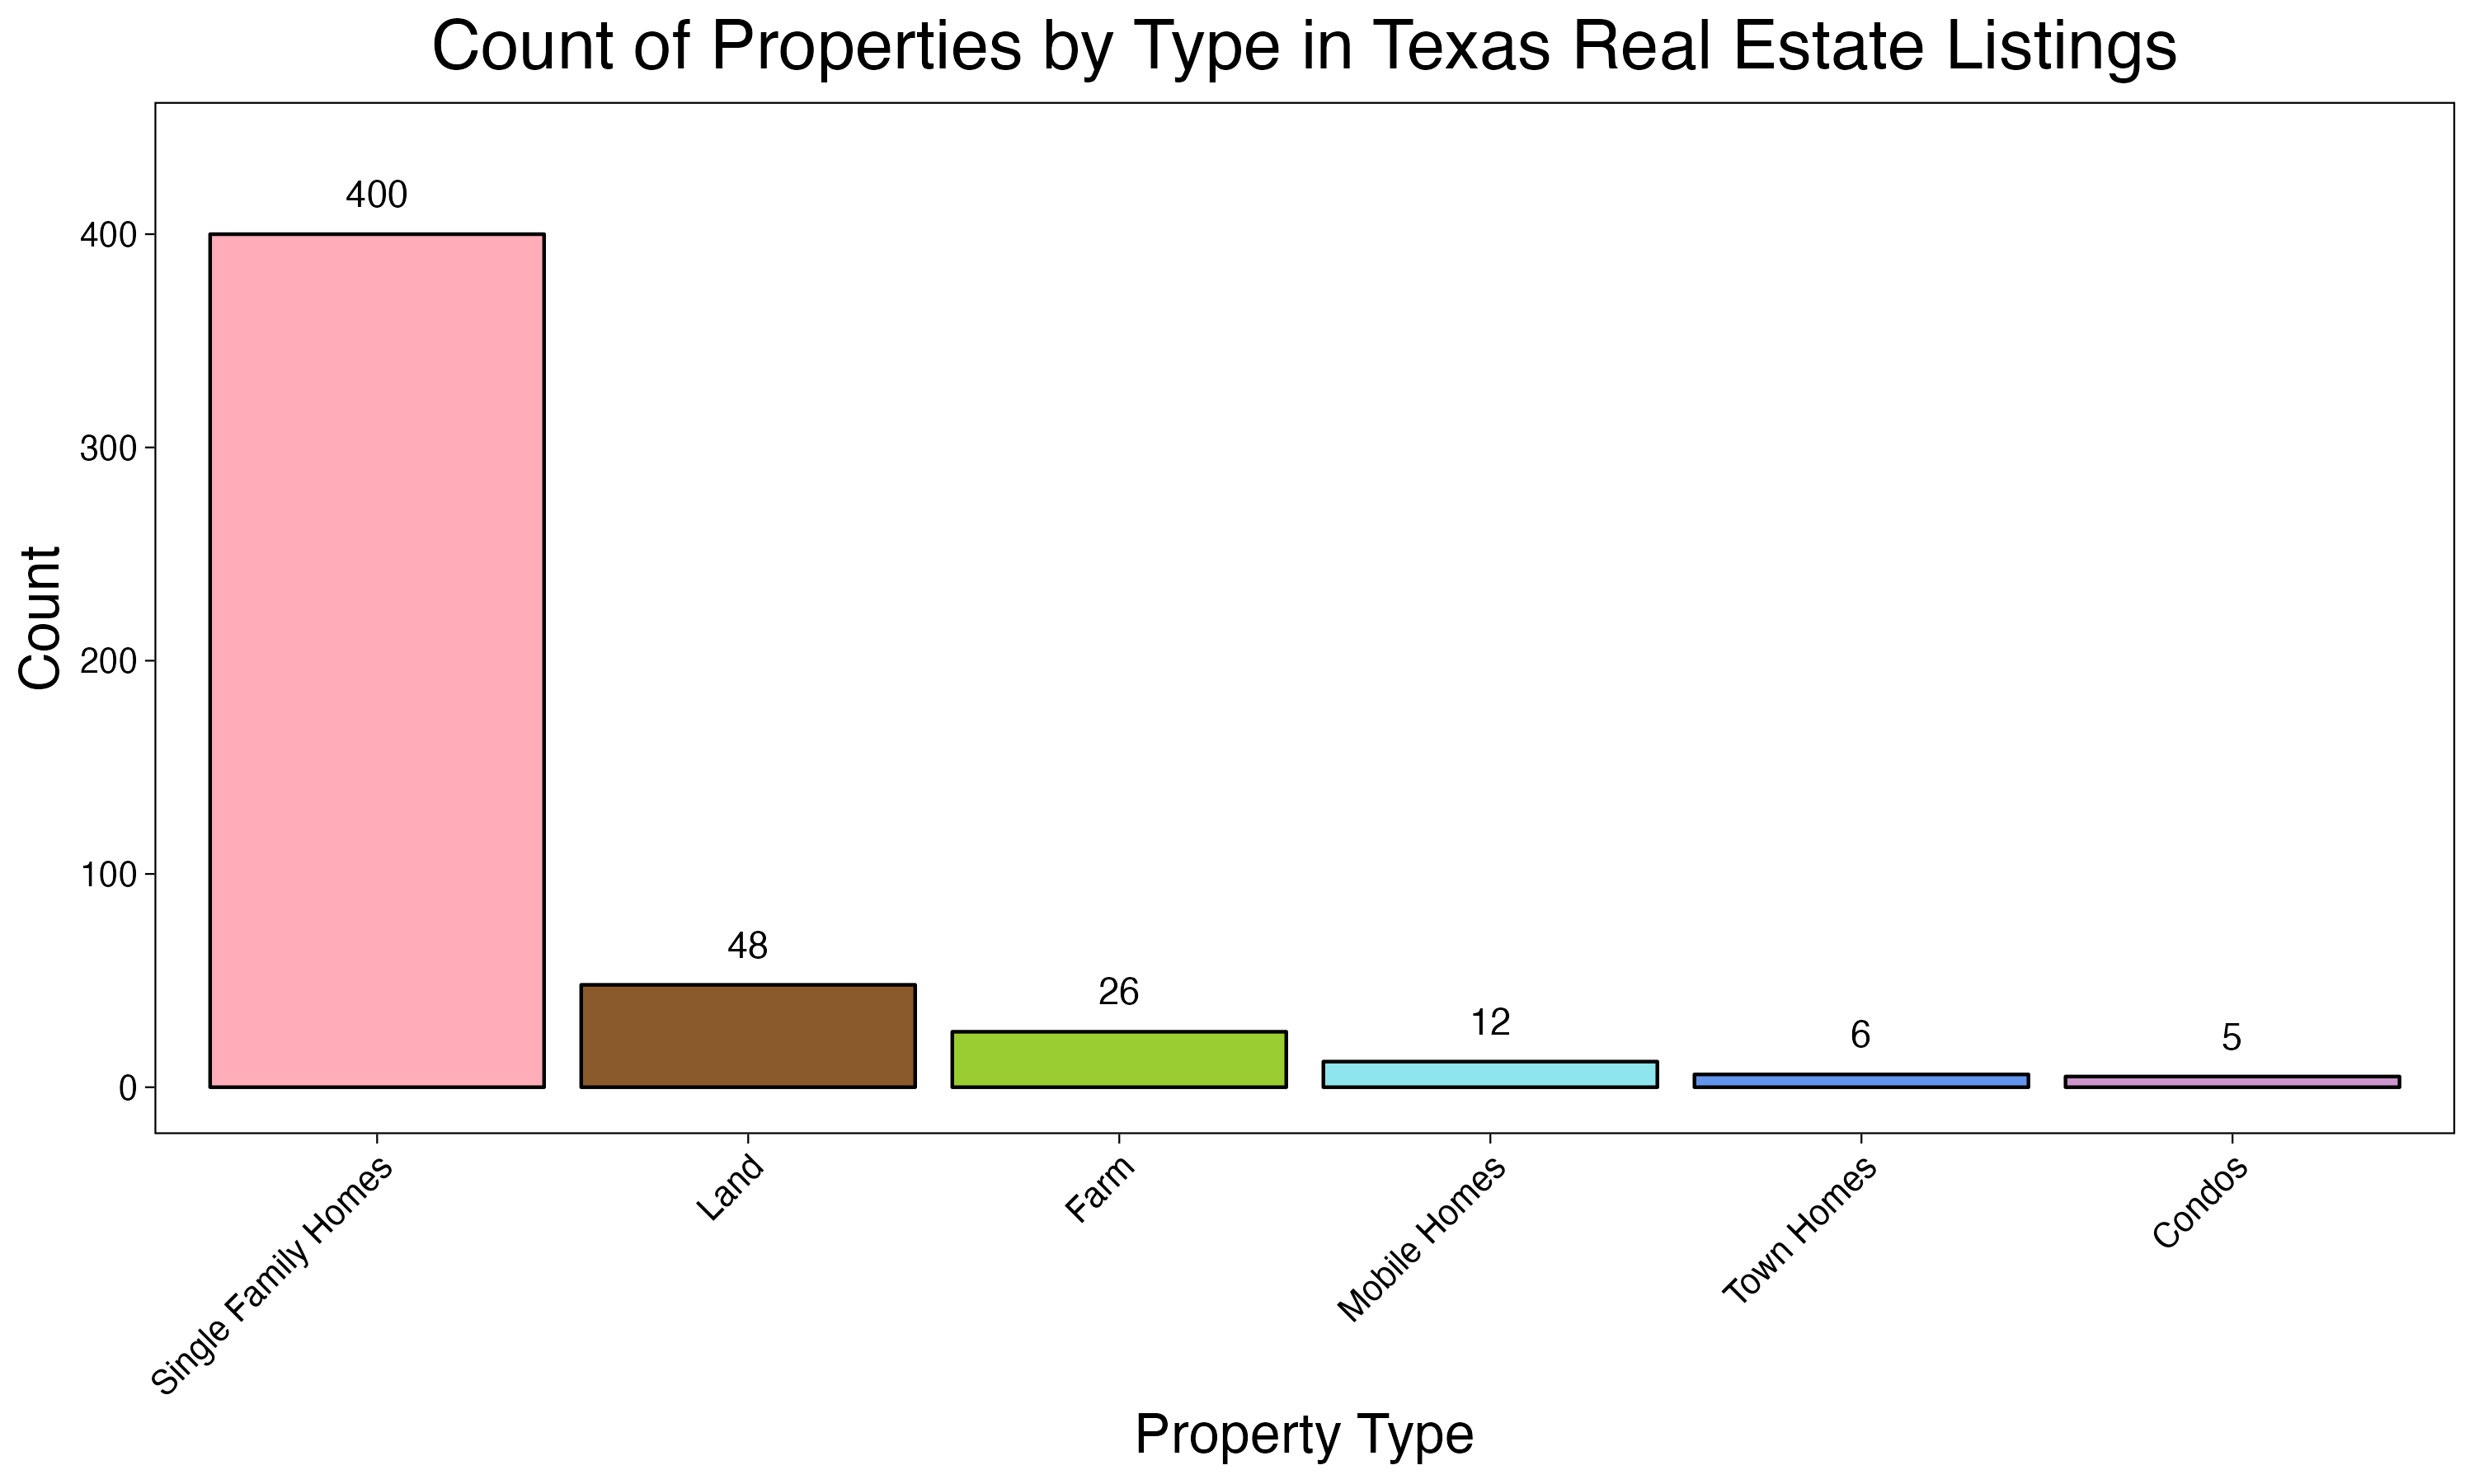
Using this bar plot, to count properties by type, the assumption about the large presence of single-family homes in the dataset can be confirmed, with 400 listings. This explanatory visualization displays the sums of each type at the top of the bar to inform the reader of the exact count, and the size of the bars allows us to gauge each type’s impact on the dataset visually. Exploring this property type further might provide great insights due to its large significance. It will allow us to make reasonable estimations when diving deeper.
Average Single-Family Home in Texas
Now that we’ve confirmed that single-family homes have a large presence in this dataset, exploring its variables should give us a better understanding of what the average single-family home listed for sale in Texas could look like.
These histograms below explore the distribution of square footage, in skyblue, and the distribution of listing prices, in darkolivegreen, for single-family homes.
The red Kernel Density Estimate curves in both graphs have been smoothed for the data and appear to be skewing towards the right, which indicates similar patterns across different variables in single-family homes.
As square footage increases, the frequency of homes listed for sale decreases. Similar to how when the listing price increases, the number of listings decreases as well. We can probably assume that the outliers in each of the graphs could be related.
Based on these explanatory visualizations, at first glance, we can estimate that the average single-family home listed for sale in Texas has about 2000 sqft with a listing price of about $450,000 within this dataset.


To get a better picture as to what other variables define this property type, this heatmap below, displays the spread of bathrooms vs bedrooms across the 400 single-family homes. In this explanatory visualization, there are 4 predominately darker tiles, with 3 bedrooms/ 2 bathrooms appearing to have the darkest tile. The YlGnBu sequential palette was intentionally applied so the reader can decode the increase in the count of single-family homes as color goes from light to dark.

In summary, after exploring this property type further with various techniques, we can get an idea as to what the average is from this dataset. So, if a family is looking to purchase a single-family home in Texas, they’ll get a better understanding of what to expect in the real estate market.
| Variable | Calculated Average | Average from Reader |
|---|---|---|
| Listing Price | $457,608.30 | ~ $450,000 |
| Square Footage | 2,226.75 | ~ 2,000 |
| Bedrooms | 3.53 | 3 |
| Bathrooms | 2.6875 | 2 |